Column
This dialog window provides four sets of information pertaining to the data in the selected table column.
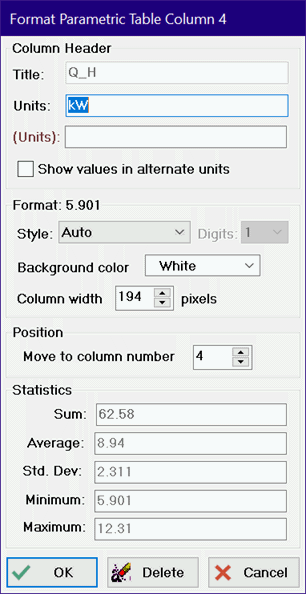
The column title is the name of the variable for the Parametric , Arrays , and Integral tables. This title identifies the column and cannot be changed. The column title for Lookup tables, however, may be changed. The data in this column may be referenced by its title, as explained in the Interpolate and Lookup commands. The units of the data in the column may be changed for all four table types. Right clicking or double-clicking in the Units field will bring up the Units List dialog from which you can select a units string - eliminating the need to key the units string in.
A field is provided for an alternate set of units for all four table types. If an alternate set of units is provided, it must have the same dimensions as the primary units. If the Show Values in Alternate Units is checked, values of the variable will be displayed in both units with the values in the alternate units shown in brown font and with curly braces. See Using Alternate Units for additional information.
The Units edit box will display 'mixed' when displaying the Arrays table if units for the array elements are not all the same. Changing the field from 'mixed' to a unit designation will change the units of all elements in the array to the specified units.

The display format of the data in the column can be changed by selecting the style and number of significant figures for the formatted numbers in the table. Note that number of significant figures can be an integer between 0 and 9 or the letter 'M' which indicates that maximum number of figures. This choice does not affect the calculation accuracy, but just the display. Note that the format style can be set to STRING for the Lookup Table. The STRING specification is required if the column is to hold string rather than numerical data. Time format and Date and DateTime formats options are also available.
The background color of the data in the column can also be changed by clicking on the background color control menu. The background color can be used to highlight the data or for other purposes such as to indicate which columns in a Parametric table require user input values.
The column can be moved to a different position in the table by clicking on the spin button arrows. The number displayed in the column box is the column number that this column will appear in when the OK button is clicked. Note that column numbers are shown at the upper left of each column header cell.
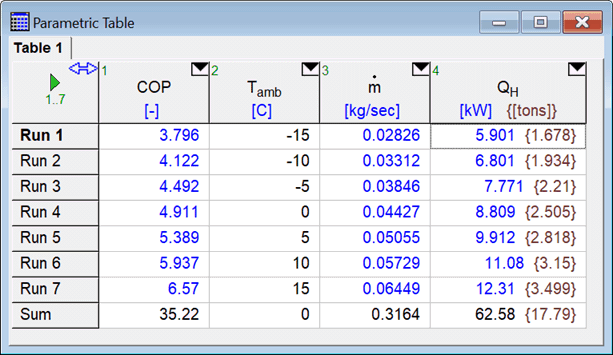
The sum, average, standard deviation, minimum and maximum of the values in the selected column are displayed in the Statistics box. The values in these boxes can not be edited, but they can be copied. If a column holds the results from an Uncertainty Propagation Table command, the Sum field will display the sum value along with the uncertainty of the sum calculated as the square root of the sum of the squares of the uncertainty values in the column. Note that the sum of values in a Parametric table column is displayed when the "Include a Sum Row in the Parametric Table check box is selected in the General tab of the Preferences dialog. Also, the SUMPARAMETERIC and SUMLOOKUP functions return the sum of the values in the Parametric and Lookup tables, respectively.
See also: Change Table Column Values