Property Plot
The Property Plot command creates a new plot window with thermodynamic property data for a selected substance. Once created, additional property data or thermodynamic cycle state points can be superimposed on the plot using the Plot_Overlay_Plot command.
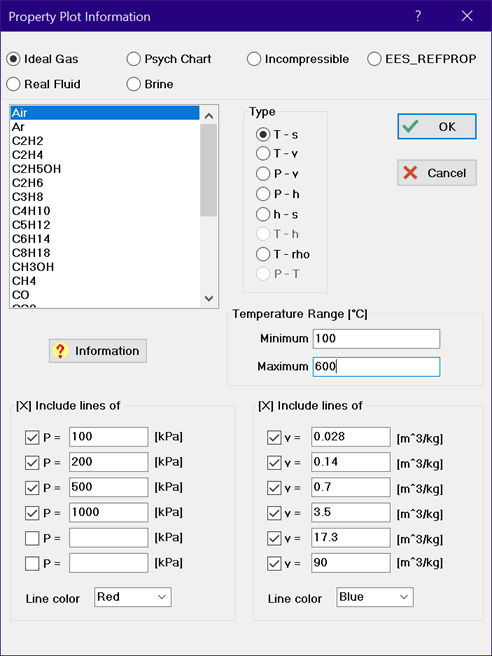
Select the substance type from the radio buttons at the top of the dialog. Then select the substance from the list at the left. Information relating to the substance model can be obtained by clicking the Fluid Info button below the list.
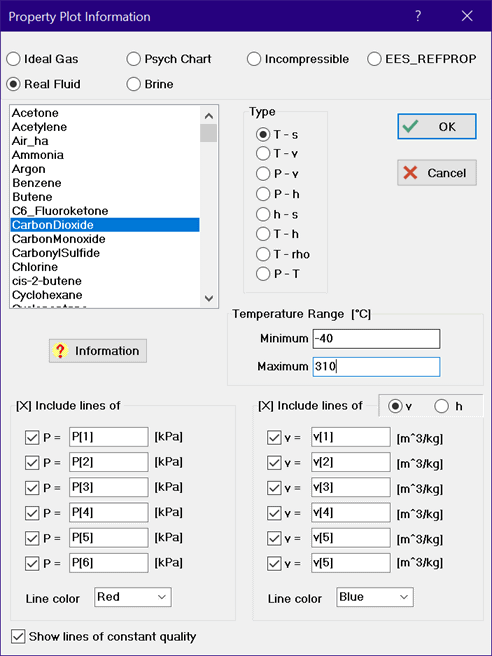
For Ideal Gas and Real Fluid substances, eight buttons are shown that allow a specification of Temperature-entropy (T-s), Temperature-volume (T-v), Pressure-volume (P-v), Pressure-enthalpy (P-h), Enthalpy-pressure (h-s), Temperature-enthalpy (T-h), Temperature-density (T-rho) or Pressure-temperature (P-T) coordinate systems. The T-h and P-T plots option are available only for substances that are represented by the high accuracy fundamental equation of state. These substances are identified in the Fluid Property Information window. Several sets of controls will appear in which 6 values of additional properties, such as isobars, isotherms, and/or isentropes can be specified. Suggested values of these properties may be provided in the edit boxes. To display lines of constant properties, click the check box so that an X appears in the box and then enter or modify the existing value for the property. EES variables that have defined values can be used in place of numerical values (starting with version 10.653) as demonstrated in the dialog for CarbonDioxide at the upper right. The color of these additional property lines can be selected from the drop-down controls below the 6 values.
When selecting any of the property plots for ideal gases, real fluids or EES_REFPROP, the minimum and maximum temperatures or pressures that will be used to construct the plot are displayed, as shown for air at the upper left. Moving the mouse into the minimum or maximum edit box will cause a hint box to be displayed showing the possible range that can be entered. Note that the scaling of the axes is done separately so as to include all of the plotted data with a well-defined scale. The limits of the equation of state will override the entered settings.
The P-T plot is only applicable for real fluids. This plot option will display the vaporization curve and critical point for the selected fluid in pressure-temperature coordinates. For mixtures that exhibit a temperature glide (e.g, refrigerants having an R5xx name), the bubble point and dew point lines will both be displayed. In addition, the triple point, fusion (solid-liquid) and sublimation (solid-gas) lines will be displayed if this information is available.
The values for specific enthalpy and specific entropy depend on the selected reference state. Real fluids modeled with a high-accuracy equation of state allow the reference state for enthalpy and entropy to be changed using the $Reference directive. The directive must be executed before using the Property Plot command.
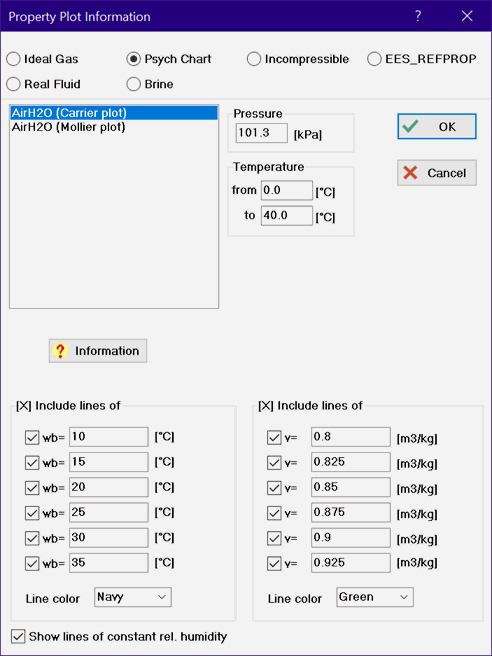
Selection of the Psych Chart button will result in a psychrometric plot for substance AIRH2O in either the Carrier or Mollier format as shown in the figure at the middle left. AIRH20 allows lines of constant relative humidity, web-bulb temperature and specific volume to be placed on a psychrometric chart.
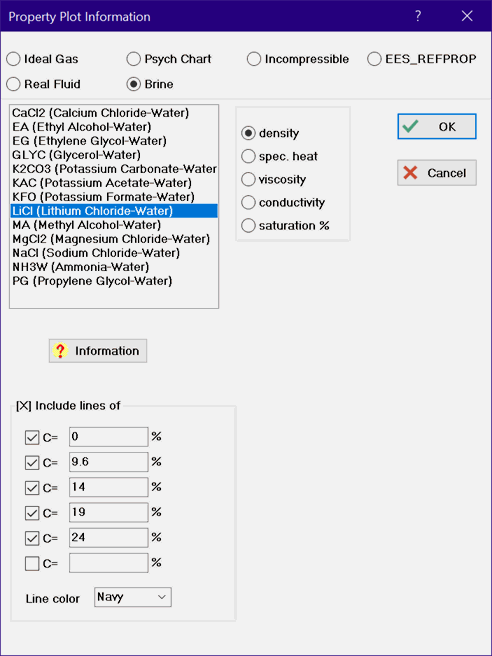
Selection of the Brine button will provide the option of plotting density, specific heat, viscosity or thermal conductivity as a function of temperature for up to six specified mass concentrations of the brine in water, as shown in the figure at the middle right.
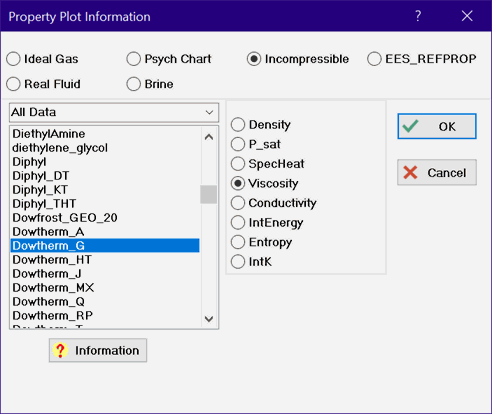
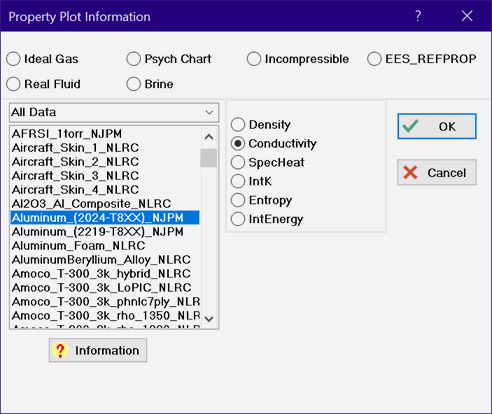
The Incompressible Substances library must be loaded before the plot can be created. If the selected library has not been loaded, you will be given the opportunity to load it before proceeding with the plot. The properties that are available to plot versus temperature are shown in the radio button list to the right of the list of substances. Different properties are available for different fluids. Note that the plots have not been spline-fit. You can turn on the spline fit using the Modify Plot command, as well as use symbols to show the actual data that are in the database. In some cases, only one data point is available in the library. In this case, the plot will show a single point.
The EES_REFPROP button provides access to property data from REFPROP. This capability requires the EES_REFPROP interface, dated May 27, 2022 or later. See Property Plots Using the EES_REFPROP interface for information.
Calculated property data can be superimposed on a property plot using the Overlay Plot command. To construct plots of this nature, it is most convenient to place the properties that are to be plotted in arrays using square brackets to enclose the array index, e.g., T[1]. In that way, the property values will be displayed in the Arrays window after calculations are completed and they can then be directly plotted. Also, the plot characteristics and axis scales can be modified in the usual manner with the Modify Axes and Modify Plot commands.