X-Y-Z Plot
The X-Y-Z Plot command provides 6 options for displaying data of the form Z=f(X,Y)
1) Contour-Lines: displays lines of constant Z in X-Y space (2-D projection)
2) Contour-Bands: uses colors to represent the value of Z in X-Y space (2-D projection)
3 ) Contour-Gradient: uses arrows to show the direction of the gradient with the length of the arrow being proportional to the magnitude of the gradient (2-D projection)
4) 3D Surface: displays a 3-D rotatable surface projection using orthogonal or perspective coordinates (available only with the 3-D plotting option selected during setup).
5) 3D Polygon/Points: displays up to 6 polygons optionally with points and/or lines on a rotatable surface projection using orthogonal or perspective coordinates. (Available in the Professional license.)
6) Symbol Color: display a plot of Y versus X with symbols colored to represent the values of Z. (Available in the Professional license.)
Note that all six types of X-Y-Z plots have additional options that can be viewed or changed after the plot is constructed by right-clicking on the plot to bring up the Modify Plot dialog.
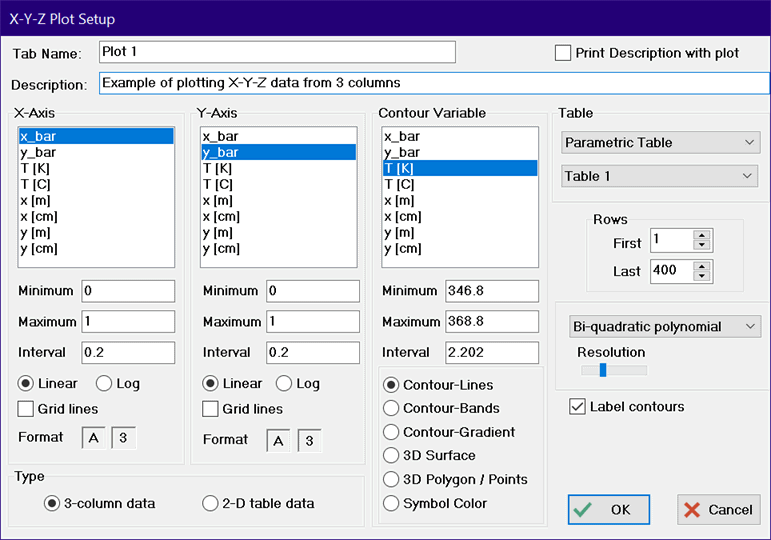
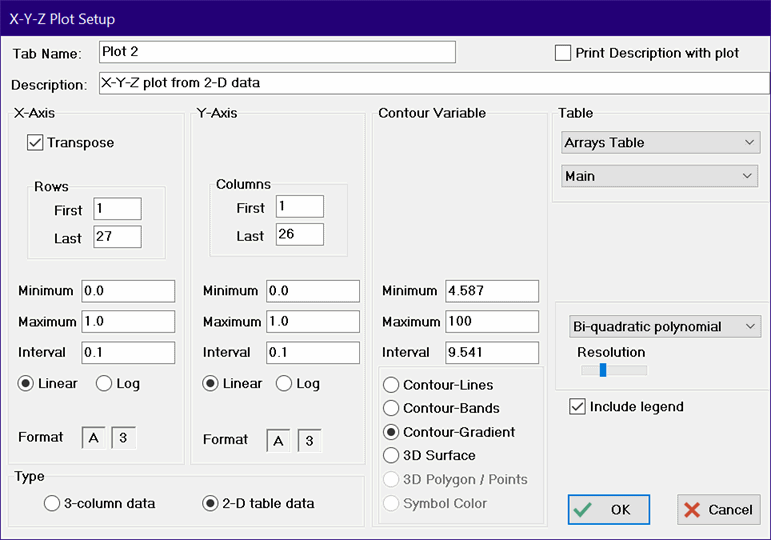
X-Y-Z plots require three-dimensional data for construction. The data are normally provided either in 3 separate columns for the X, Y, and Z variables. Except for the 3D Polygon/Points plot and the Symbol Color Plot, the data may alternatively be provided in a 2-D table. In either case, the data used to construct the plot can be from the Parametric, Lookup, Arrays or Integral table windows. The table from which the data are taken is selected from the drop-down controls at the upper right of the dialog.
If the 3-column data radio button is selected, EES will expect that three dimensional data to be provided in three columns chosen from one of the table windows. The X, Y, and Z variables are then selected from the three lists. Data provided in this form need not be in any particular order. If the 2-D table data radio button is selected, EES will assume the column numbers in the table are proportional to the X-coordinate whereas the rows are proportional to the Y-coordinate. If the Transpose button is checked, the column numbers in the table will be proportional to the Y-coordinate and the rows will be proportional to the X-coordinate. The Z-values will be read from the table. Controls are provided to allow a subset of rows and/or columns in the table to be plotted. The X and Y axis scaling is, by default, set from 0 to 1, but it can be changed as desired for the axis scale display.
To prepare the X-Y-Z plot for all of the options (except the 3D Polygon/Points and Symbol Color plots) the selected data must be interpolated or extrapolated as necessary to provide values of variable Z over the entire range of X and Y at relatively fine intervals. Two different algorithms are provided to do this gridding. The choice of gridding algorithm is made from the drop down list at the lower right of the dialog box. The grid size is controlled by the Resolution slider control. When the slider is positioned at its left-most point, the grid size is 50 by 50 units. At the right-most point, the grid size is 100 by 100.
Radial Basis Function
With this approach, the selected data are first scaled and then fitted to a function of the form
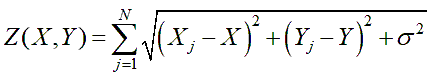
where N is the number of data points, the w values are weighting factors, and s is a relative smoothing parameter which, based on experimentation, is best set to zero for numerically-generated data. However smoothing may be needed for experimental data or for sparse data sets. Moving the Smoothing slider bar to the right increases s which increases the smoothing effect.
The weights are found by solving the linear system of N equations that force the above equation to perfectly represent the provided data. Once the weights are determined the equation is used to interpolate or extrapolate the values of Z to particular values of x and y. The computations needed to determine the weights are O(N cubed) so there is a practical upper limit to the number of points (N) that can be accommodated. This upper limit is controlled by the Resolution slider. If more data points are provided than are specified by the Resolution slider, EES will select a subset of the data using a clustering algorithm. At full resolution, you may have to wait a while for the plot to be prepared depending on the speed of your computer.
Bi-Quadratic Polynomial
With this approach the data are fitted to a second-order polynomial of the form:
![]()
A separate set of the coefficients is fitted for each point in the grid using weighted linear least squares. The number of grid points, controlled by the setting of the Resolution slider, ranges from 2,500 to 10,000 .
Contour Plots
Two-dimensional contour plots may be produced using Contour-Lines or Contour-Bands plot options. The Contour-Gradient option allows gradient arrows to be superimposed on a Color-Bands plot. The number of lines or bands is determined by as the difference between the maximum and minimum values divided by the interval value. In the Contour-Lines plot, each line (up to a maximum of 25) is a separate plot overlay, whereas the Color-Band plot is simply one plot. The Contour-Bands option allows up to 250 colors. Note that selecting a large number of colors (~50) results in a plot that has nearly continuous colors. The contours can be displayed in shades of gray, or colors range from red to blue or using the full spectrum. The choice of color scheme can be changed in the Modify Contour/Gradient Plot dialog. A Label Contours check box control is provided for Contour-Lines plots. In this case, EES will generate a text item containing the value for each contour line and place it on the line. These text items can be moved or changed just as any other Plot window text items. If a banded color plot is chosen, an Include Legend check box is provided. If the Include Legend check box is selected, a color legend will be displayed to the right of the plot relating colors to the values of Z. Note that, on a color band contour plot, you can read the value of Z directly in the Plot Window title bar at any X-Y position by holding the Ctrl and Shift keys down and moving the mouse. An X-Y or bar plot can be overlayed on 2 two-dimensional contour plot using the Overlay Plot command.
3D Plots
The 3D Surface and 3D Polygon/Points options use a three dimensional plotting package is based on a modification of the public domain GLScene package (https://www.glscene.org/). The plot has been modified to work within EES and to optionally display values of a 4th dimension with color or gray scale for the 3D Surface. For example, it is possible to display the temperature as a color on an X-Y-Z surface. The color variable is selected by clicking on header for the Z-Axis variable. This action will cause the list to display the Color variable. The color variable list is shown in yellow to make the distinction clear. If a color variable is not selected, it is assumed to be the same as the Z-axis variable. After it is constructed, the three-dimensional plot can be rotated about its center point by pressing the mouse button on the plot and dragging it in the desired direction. A number of controls are provided to, for example, scale the image, set colors, and display grids and surface grid lines. These controls are provided on the 3-D plot control panel. Only one 3D Surface Plot can appear in a plot window but the Professional license allows 3D Polygon/Points plots to be overlayed on the 3D Surface plot, provided that the 3D Surface plot is the first plot in the plot window.
The 3D Polygon/Points plot will plot a three-dimensional representation of tabular data provided in three separate columns of any of the tables. This option is only available in the Professional license. Clicking the 3D Polygon/Points button will change the display as shown in the following figure.
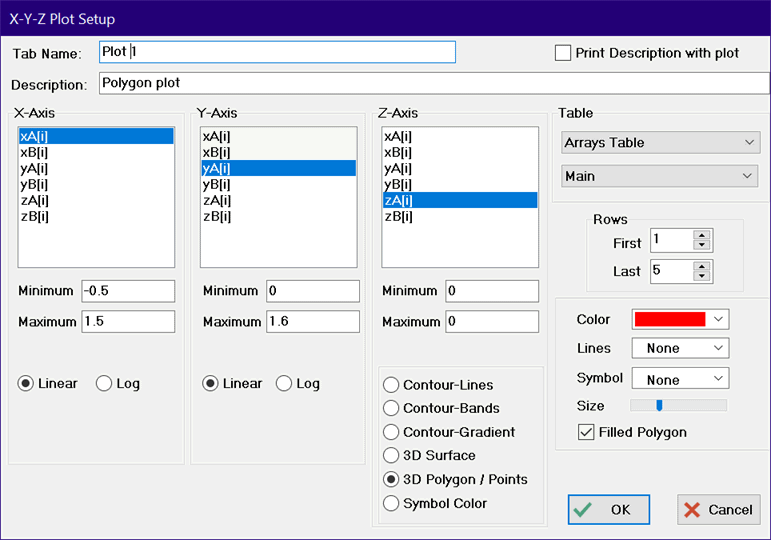
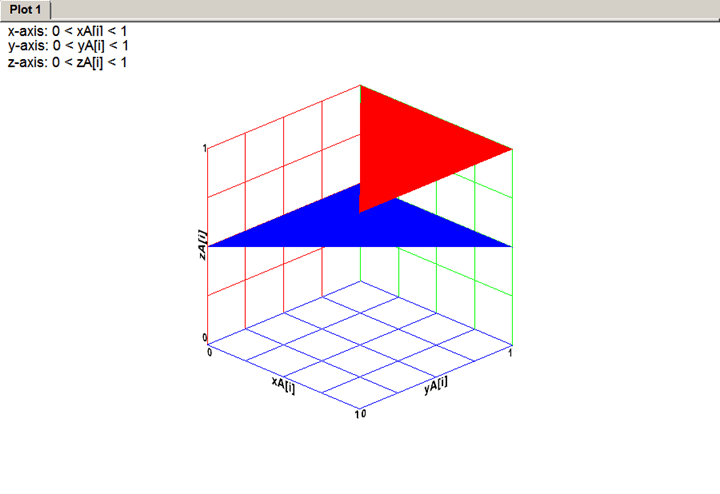
The minimum and maximum values for the X, Y and Z axes can be specified. Only points within the specified ranges will be plotted. The color, line type, symbol and symbol size, and filled polygon option can be specified. Up to 5 overlays are allowed for the 3D Polygon/Points plot. Once the plot has been constructed, there are a number of additional controls on the 3-D plot control panel that can be changed to affect the appearance of the plot. Shown below is a plot of two polygons, produced by creating a new X-Y-Z plot for the first polygon and overlaying the second polygon using the Overlay Plot command.
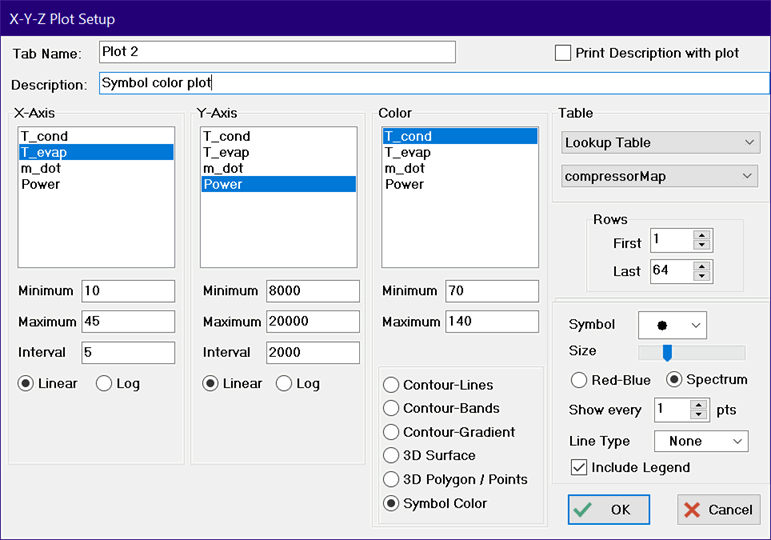
Symbol Color Plot
The Symbol Color plot (available in the Professional license) provides a traditional 2D plot of X versus Y using symbols, but the colors of the symbols are chosen relative to a third (Z) variable. A choice of symbol type, size, frequency and color scheme (Red to blue or Full Spectrum) is provided. Lines may be optionally drawn to connect the points. If the Include Legend box is selected, a color legend will be provided to the right of the plot to relate the symbol color to the value of Z. A label is provided below the legend to identify the variable relating to the color of the symbols. The label can be modified or deleted by clicking the right-mouse button in the label rectangle when the plot toolbar is visible. Changes in the plot options can be made by right-clicking on the plot or by selecting the Modify Plot menu command. Normal X-Y plots can be overlayed on a Symbol Color plot.
See also: New3DPlot Macro
Return to Plot Menu